
Validation of the tar dew point model
The in-house tar dew point model has been validated downstream the fluidised bed gasifier (WOB) at TNO. The model has been validated by:
- using a tar condensor
- using an on-line tar dew point analyser (TDA)
The air blown gasifier has a capacity of 1 kg biomass/hour and was operated at atmospheric pressure and a temperature of 850°C.
As a result, the in-house tar dew point model has an accuracy of ± 3°C in the temperature range of 20°C to 170°C. The heavy tar compounds dominate the tar dew point, which means that even at low concentrations these compounds start to condense at relatively high temperature. Therefore, when heavy tars are present in the gas, but not included in the measurement, a large error is potentially created and the calculated dew point will be an underestimate.
Model validation using a tar dew point analyser (TDA)
The process flow diagram for the model validation with the TDA is given in
Figure 1. Raw product gas was drawn through a filter and tar condensor and
subsequently fed to the TDA. The TDA is an analyser developed by TNO and
Michell Instruments that continuously measures the tar condensation temperature
in biomass product gas, using a sensor cell with an optical surface. For more
information please download the report ECN-C-05-009, Tar dew point analyser. At
the inlet of the TDA the tar composition was measured with the SPA method.
Subsequently, the tar dew point was calculated from the tar composition and
compared with the tar dew point measured with the TDA.

Figure 1: Process flow diagram for validation of tar dew point model with tar
dew point analyser, TDA.
Figure 2 compares the calculated tar dew point with the measured tar dew point. The measured tar dew points are similar to the calculated values. In the temperature range of 25°C to 150°C the difference is at most 2°C. At a dew point of approximately 170°C the measured tar dew point was 7°C to 14°C lower than the calculated tar dew point.

Figure 2: Comparison of the calculated tar dew point with the measured tar
dew point. On the Y=X line the calculated tar dew points equal the measured tar
dew points.
Model validation with the tar condensor
The process flow diagram for the model validation with the tar condensor is
given in Figure 3. Raw product gas was drawn through a filter and fed to the
tar condensor for the saturation of the product gas with tar. Downstream the
condensor the tar composition was measured with the SPA method. The tar
dew point was compared with the temperature of the tar condensor.

Figure 3: Process flow diagram for validation of tar dew point model with the tar
condensor
Figure 4 compares the calculated tar dew point (Y-axis) with the temperature of the tar condensor (X-axis). The solid squares in Figure 4 represents the calculated tar dew point. The open rhombus and the Y=X line is the situation when the tar dew point mimics the tar condensor temperature, which can be considered as the ideal line. The difference between the calculated tar dew point and the ideal Y=X line in Figure 4 is in most cases lower than 3°C.
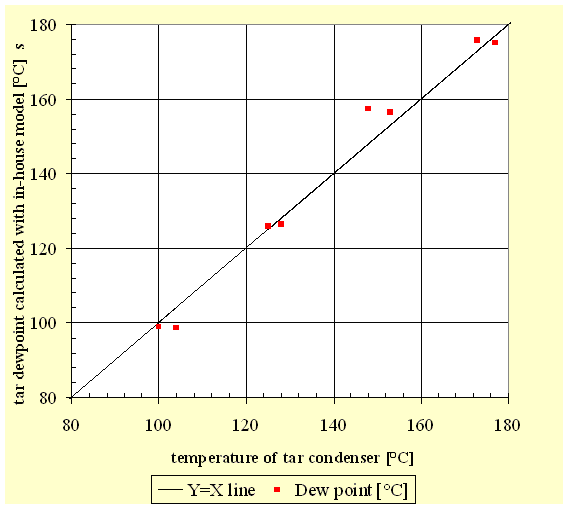
Figure 4: Comparison of the calculated tar dew point with the temperature of the
tar condensor. On the Y=X line the calculated tar dew point equals the
temperature of the tar condensor.
The difference in the tar dew point and the temperature of the condensor can be caused by a sum of errors:
- Error in the temperature (measurement) of or incomplete mass transfer in the tar condensor
- Error in the tar measurements.
- Error in the dew point calculation.
